DomainColoring.jl: Smooth Complex Plotting
Welcome to the documentation of DomainColoring.jl, a collection of various ways to plot complex functions for research, teaching, and fun, supporting both Plots.jl and Makie.
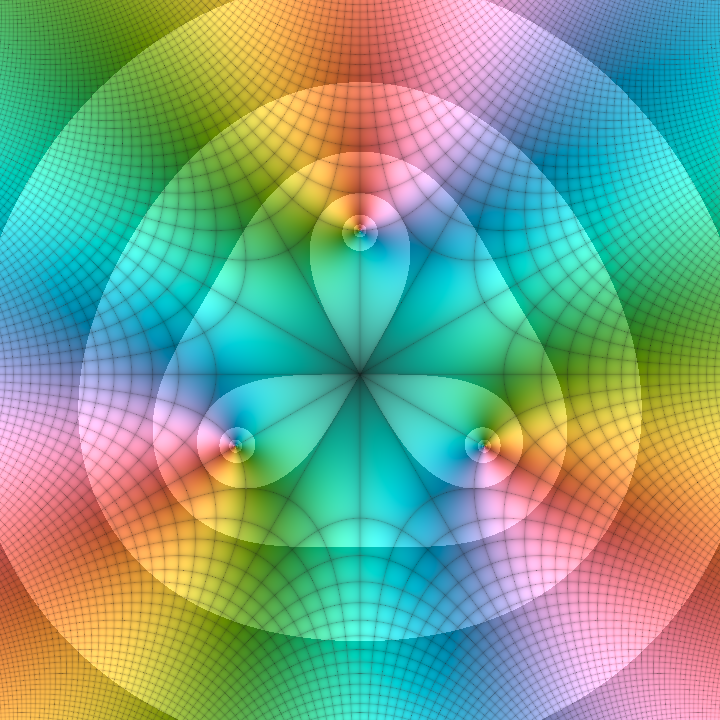
In addition to the static plots provided here, interactive versions using GLMakie, and various 3D visualizations, are available as part of the ComplexToys.jl package.
Domain coloring was first proposed by Farris[1] and later popularized by the wonderful book by Wegert[2]. The plots in this package are mostly inspired by the designs in the latter, yet using a smooth curve through Oklab space, yielding a more perceptually uniform representation of the phase (see The Arenberg Phase Wheel).